Visualize your home lab with Grafana and Prometheus

Grafana is an open-source visualization program that allows you to connect to a plethora of data sources, and visualize and plot data in just about any way you’d want to. I’m still learning the ins and outs of the dashboard builder, so my custom dashboards are still relatively simple, but some some users have built some truly beautiful and useful dashboards for their environments, some of which are importable via dashboard ID or JSON structure.
Today I’ll be walking you through the basics: Installing Grafana, gathering data using a monitoring system and time-series database called Prometheus, and building your first Grafana dashboard.

My first Grafana dashboard. (click to view full-screen)
Contents:
Step 3: Install and configure exporters
Step 4: Grafana Explore, and adding a data source
Step 5: Build your first dashboard
Step 1: Install Grafana
In this tutorial, I’m going to be installing Grafana on an LXC container running Ubuntu 20.04, using the Debian/Ubuntu installation instructions. For other installation instructions such as RPM-based (CentOS), Docker, etc. check out these Grafana installation instructions.
Because we’re running this install on Ubuntu, these instructions use the apt package manager. As stated before, if you’re running something like Fedora or CentOS, use the other Grafana installation guides linked above for your distro.
We’ll need to add the Grafana repository to our apt sources, update our packages index, and install grafana-enterprise (the base install)
echo "deb https://packages.grafana.com/enterprise/deb stable main" | sudo tee -a /etc/apt/sources.list.d/grafana.list
sudo apt update
sudo apt install grafana-enterprise
And that’s pretty much it for the initial installation. Enable the service to run on boot, and make sure it’s running properly.
sudo systemctl enable grafana-enterprisesudo systemctl status grafana-enterprise

Check out your unconfigured Grafana at <IP>:3000 and log in with first-time credentials admin/admin. Grafana will then prompt you to set a new password.
Step 2: Install Prometheus
Without any data sources, Grafana isn’t too useful. We can view the supported data sources by going to Configuration > Data sources on the left.

Click “Add data source” on the right. From there, we can see all the supported data sources. There’s a bunch of them, for time series data, logs, databases, and even enterprise plugins for proprietary software such as Salesforce, Oracle, Splunk, etc.

For this tutorial, we’ll be gathering time series data from Linux machines using Prometheus.
sudo apt install prometheussudo systemctl enable prometheussudo systemctl status prometheus

Prometheus is now running, but it doesn’t know where to collect from. That’s where we use an exporter on each of our host devices to expose the data for Prometheus to gather, and configure which addresses to listen to.
Step 3: Install and configure exporters
On each of the machines we want to monitor, we’re going to install a popular exporter for Linux machines called node_exporter. This exporter will expose the data Prometheus will collect.
sudo wget https://github.com/prometheus/node_exporter/releases/download/v1.2.2/node_exporter-1.2.2.linux-amd64.tar.gz
sudo tar xvfz node_exporter-*.*-amd64.tar.gz
cd node_exporter-*.*-amd64
Let’s run the exporter to make sure it works.
./node_exporterWhile this is running, you can visit <IP>:9100/metrics to view the raw data for yourself. You should see a bunch of lines like this:

However, we need to make this node_exporter run as a service, instead of leaving it manually running in the foreground.
sudo useradd -rs /bin/false node_exporter
sudo mv node_exporter /usr/local/bin
sudo vim /etc/systemd/system/node_exporter.service
Add the following configuration:
[Unit]
Description=Node Exporter
After=network.target

[Service]
User=node_exporter
Group=node_exporter
Type=simple
ExecStart=/usr/local/bin/node_exporter

[Install]
WantedBy=multi-user.target
Save and exit the file. Now we run the service, and ensure it’s online:
sudo systemctl daemon-reload
sudo systemctl start node_exporter
sudo systemctl enable node_exporter
sudo systemctl status node_exporter
After we’ve validated that the node_exporter service is running properly on the host we want to monitor, we’ll need to tell our instance of Prometheus to listen for it.
On your Prometheus server, edit /etc/prometheus/prometheus.yml
At the bottom, look for a job name of “node_exporter_metrics”. If you don’t see one, go ahead and add the following section to the bottom of the config file:
- job_name: 'node_exporter_metrics'
 scrape_interval: 5s
 static_configs:
 - targets: ['<IP>:9100']
Replace <IP> with the IP or hostname of the target devices you want to monitor. For multiple devices, simply comma-separate them such as:
- targets: ['192.168.2.10:9100', '192.168.2.20:9100', 'webserver.mysite.com:9100']
Restart the Prometheus server, and check the status to make sure no errors occurred since modifying the configuration.
sudo systemctl restart prometheus
sudo systemctl status prometheus

Now we should be able to see the targets visible to Prometheus! By visiting <prometheus_ip>:9090/targets, you should see something similar to the node_exporter metrics section in the image below.
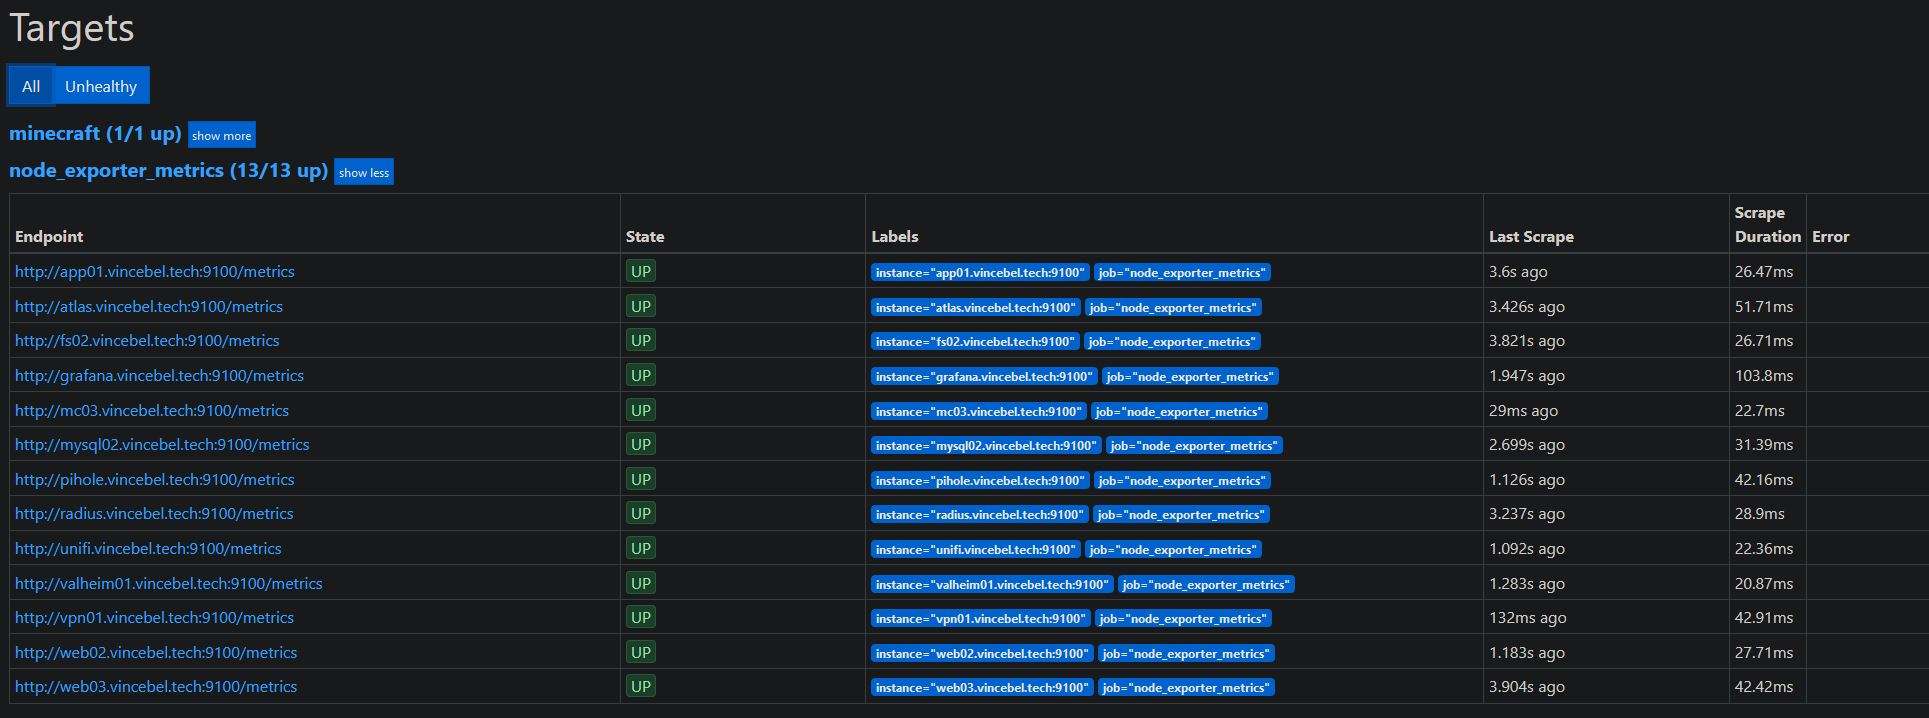
Prometheus targets (click to view full-screen)
Step 4: Grafana Explore, and adding a data source
Now that we’re gathering data with Prometheus, we’ll want to use it as a data source in Grafana, so we can start building dashboards. In Grafana, head back to Configuration > Data sources and click “Add source” like in Step 2. This time we’ll select Prometheus.
If you’ve installed Prometheus on the same server as Grafana, it’s as simple as putting http://localhost:9090 for the URL, leaving the rest as-is, and hitting “Save & test” at the bottom. If Prometheus is hosted on a different server, swap out localhost with the Prometheus hostname or IP address.


We can test the data source using Grafana Explore, the compass on the left toolbar (or /explore).
You’ll see for query A, it will default to our only data source, Prometheus. Let’s start with possibly the simplest query: up. For each target, this returns a value of 1 if the target is responding, and 0 if it isn’t. Effectively, it’s whether the machine is online, or whether the exporter is running.
Fill in the query simply with “up” (or explore other options using the Metrics browser to the left), and hit the Run query button in the upper right.
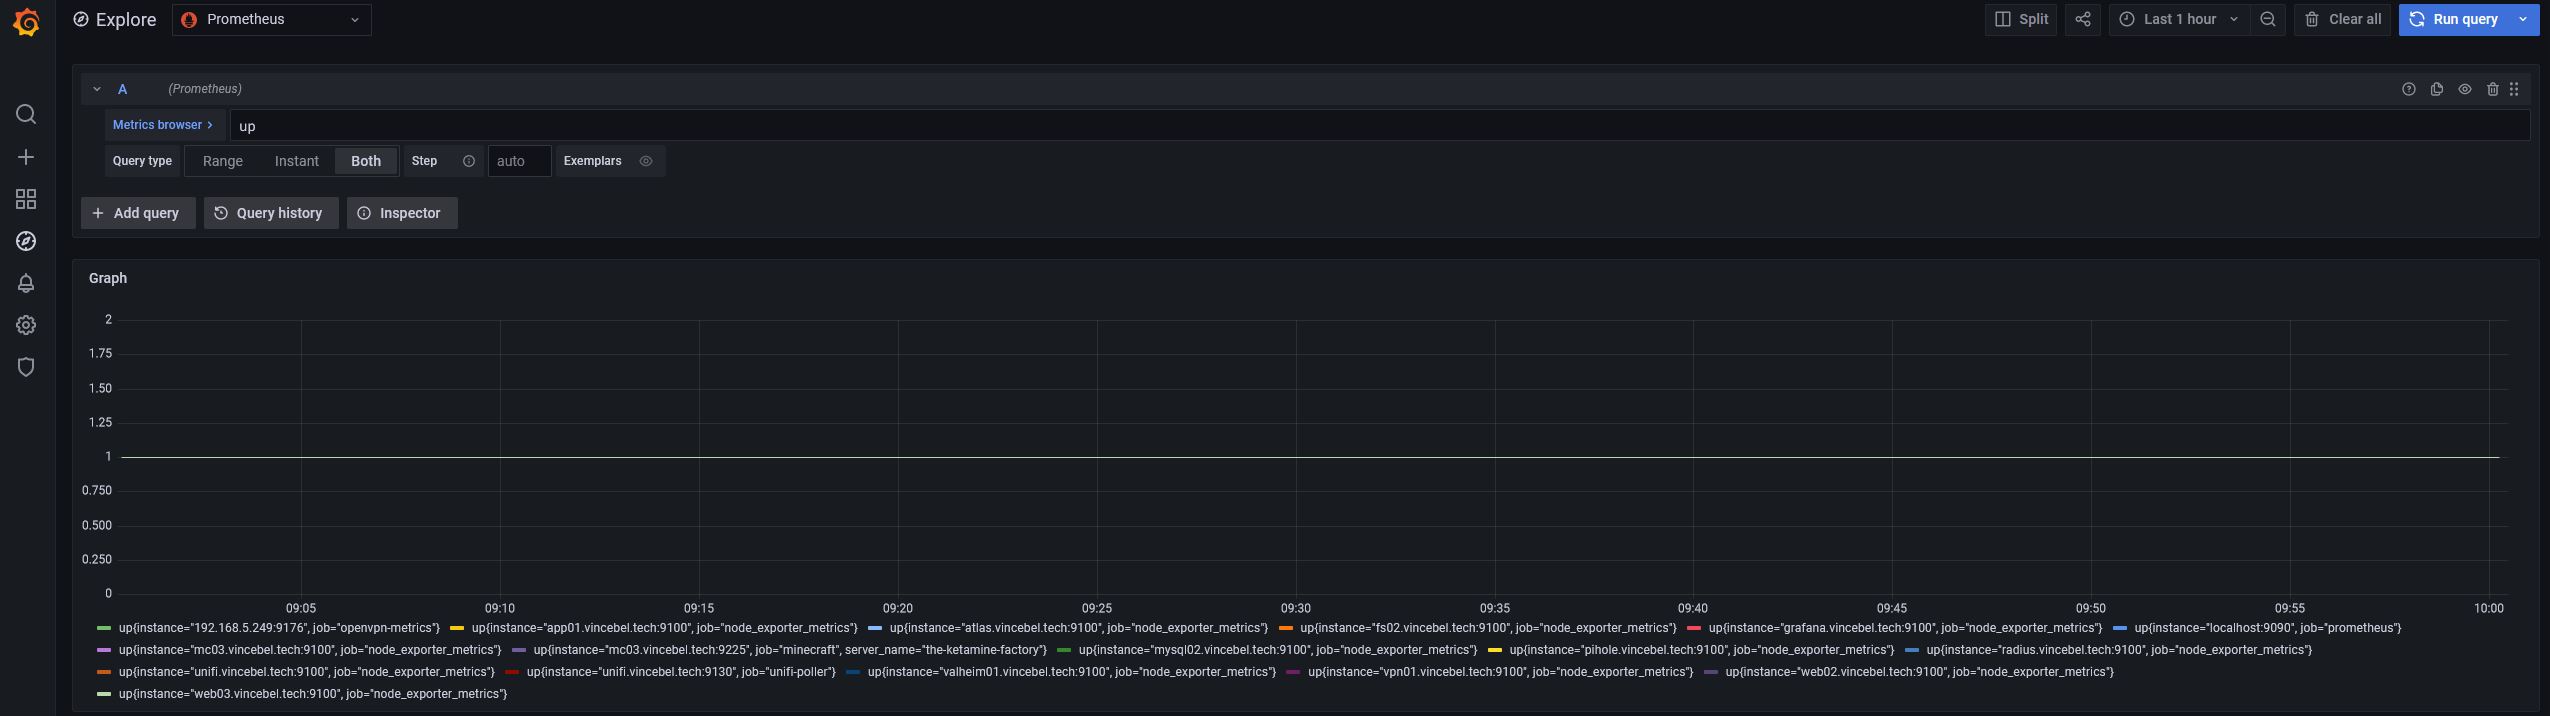
A query in Grafana Explore (click to view full-screen)
Great! Now we have the data flowing from our targets, to Prometheus, to Grafana. It’s time to build a dashboard with this data.
Step 5: Build your first dashboard
Let’s create a dashboard by clicking on the Create (+) icon on the left, and choosing Dashboard.

Once your empty dashboard appears, choose “Add an empty panel” to get started.
Near the bottom, you’ll see a familiar section – the Query editor, where we can run “up” just like we did before. This time, however, we can customize how the data is visualized in all sorts of ways, using the right sidebar.

Adding a panel to a Grafana dashboard (click to view full-screen)
Instead of a time series, which doesn’t make much sense for a binary value, let’s try switching to one of the other visualizations, such as Stat.


This is better! …sort of?
What’s happening is that the labels are just displaying as they’re being gathered from Prometheus:
up{instance="web02.vincebel.tech:9100", job="node_exporter_metrics"}
Ideally we’d want this to read as simply “web02”. To fix this, we’ll first need to filter to just the instance field, by using the keyword {{instance}} in the Legend section.


Okay, getting there. To clean up the naming a bit more, we’ll apply some regex by making use of a couple of transformations in the Transform tab.
![]()
The first transformation I applied was a “Rename by regex”, to match for the extraneous substring “.vincebel.tech:9100” and replace it with nothing.
The second transformation I applied was to filter out other targets I’m monitoring using exporters other than the node_exporter we’re using for this guide. If you’re following me step-by-step here, this probably isn’t needed. However, if you would find it useful to filter out specific targets, here’s the regex I used:
^(?!(atlas|localhost:9100|localhost:9090|192.168.5.249:9176|web03:9100|unifi.vincebel.tech:9130|mc03.vincebel.tech:9225|mc03.venus.tech:9225)$).*$
The pipe ( | ) acts as an OR operator, so add as many instance names in there to filter out as you’d like. You may also need to manually re-select “Time (x)” in case that gets unselected by applying the regex.

This is a good start! You may be satisfied with this. However, we can take things a step further by tweaking the visualization from the standard Stat settings, in the right toolbar. Two changes I made for my dashboard are thresholds and value mappings.
Thresholds: Right now, if one of our targets were to go offline, a rather boring-looking green 0 would appear.

Since convention dictates that green must be good and red must be bad, let’s make use of thresholds to catch our eye with a red 0 when a target is down.


By setting the base threshold to red, and a higher threshold for 1 to green, our values below 1 will appear red.

Value mappings: One final change we might want to make is having the dashboard show “UP” or “DOWN” instead of 1s and 0s. We can re-map each respective digit to a new text value by using value mappings.

Set your mappings to something like this:
 .
.
One other change you might want to make is removing the graph that has now appeared, under Stat styles. Toggle Graph mode from “Area” to “None”.

Perfect!
Is Stat the best visualization to show what’s offline? Probably not, but it works for me, and now you’ve just learned how to apply transformations, thresholds, and value mappings, and hopefully the gears are turning on how you can make a dashboard that suits your needs.
Conclusion

Now you have a basic but working Grafana dashboard that shows you the status of all your servers/containers! There are other metrics for memory and CPU usage, disk space, network I/O, you name it. You can play with the different metrics using Grafana Explore, or right from the panel editor. For monitoring the details of actual services, check out some more third-party exporters in the Appendix below.
Appendix
More exporters:
Unifi controller: unpoller
Minecraft server: minecraft-prometheus-exporter
OpenVPN server: openvpn_exporter
Plex: plex_exporter
Sonarr, Radarr, etc: exportarr
There are dozens more if you search the web. If you find a useful one, drop a comment below and I’ll add it to the guide for others to reference.
Thanks for reading!